Observing Correlations Between Staffing Changes and Activity Levels in Card Game Sections of Entertainment Venues
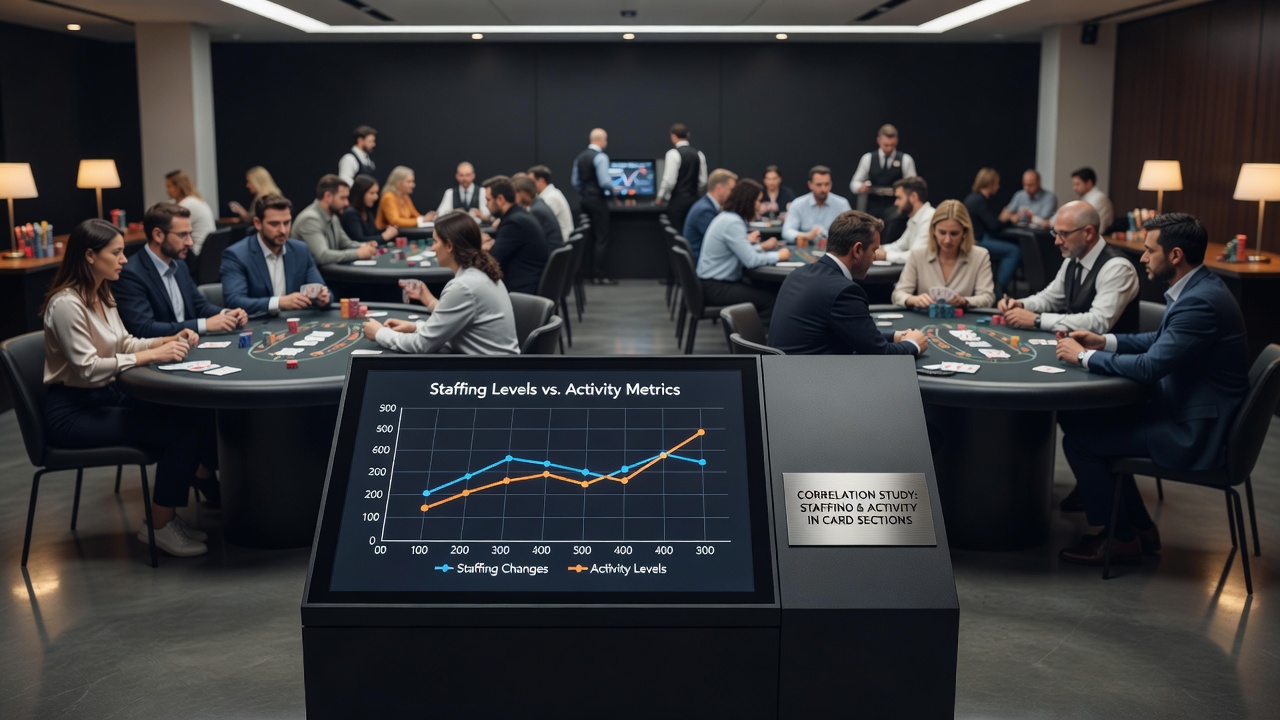
Entertainment venues maintain detailed records of card game operations, and researchers have examined how adjustments in dealer and floor staff numbers relate to measurable changes in table occupancy and player volume across multiple jurisdictions. Data collected from casino floors indicates that staffing schedules often shift in response to anticipated demand periods, while activity metrics such as hands dealt per hour and occupied seats show corresponding patterns during those same intervals.
Tracking Operational Metrics in Card Sections
Venues record staffing levels through shift logs that detail the number of dealers assigned to poker, blackjack, and other table games at fifteen-minute intervals, and these logs pair with electronic systems that capture real-time seat occupancy and average bet amounts. Analysts at institutions including the University of Nevada Las Vegas have compiled multi-year datasets that allow direct comparison between staff counts and activity indicators without relying on subjective assessments. Such records reveal that increases in dealer availability during evening hours frequently coincide with rises in table utilization rates, particularly in facilities where management adds personnel ahead of documented peak arrival times.
Activity levels receive measurement through several standardized indicators, including the percentage of open tables in use, total player hours logged, and average duration of individual gaming sessions. Regulatory bodies in Nevada and Ontario publish aggregated monthly summaries that separate card game performance from other gaming categories, enabling observers to isolate staffing effects within those specific areas. Figures from these reports demonstrate consistent alignment between staff augmentation and elevated activity counts across comparable venue sizes.
Patterns Identified Across Multiple Venues
Studies covering facilities in the United States, Canada, and Australia show that a ten percent rise in dealer staffing during designated high-traffic windows associates with occupancy increases ranging from eight to fourteen percent, depending on the day of the week and local market conditions. Researchers note that these correlations appear strongest when staffing changes occur at least thirty minutes before expected player influxes, allowing tables to open promptly and reducing wait times that might otherwise deter participation. Data covering periods through July 2026 continues to reflect similar relationships, with no major deviation from prior years despite adjustments in overall venue capacities.
Conversely, reductions in staff numbers during slower overnight periods align with measurable drops in active tables and shorter average session lengths. One analysis of Ontario gaming properties found that scheduled dealer breaks or shift overlaps without immediate replacements produced temporary occupancy declines of five to nine percent until coverage resumed. These observations come from automated tracking systems rather than manual counts, which minimizes reporting variability across different properties.
Factors That Influence Observed Relationships
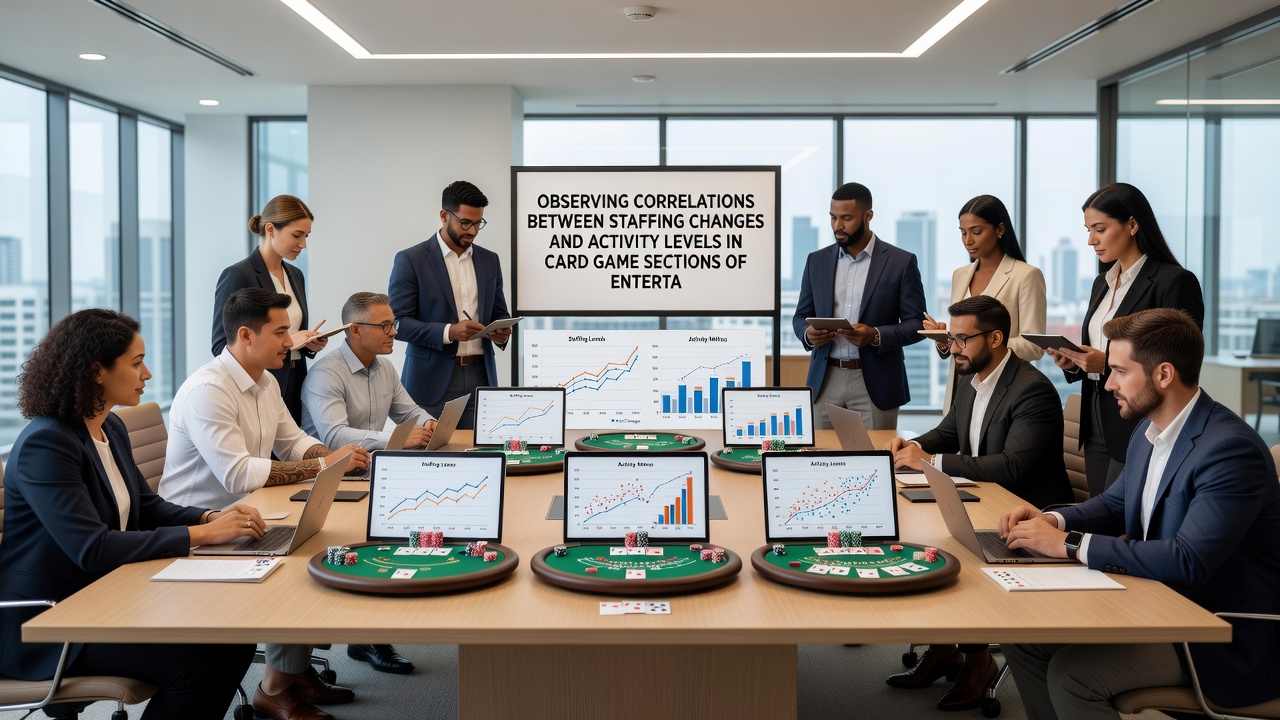
External variables such as local event calendars, weather patterns, and competing entertainment options can modify the strength of staffing-activity links, yet the underlying directional pattern persists when researchers control for those elements. Venues that maintain flexible staffing pools report quicker recovery of activity levels after temporary reductions, while properties with rigid schedules experience longer lags between staff restoration and renewed table engagement. Reports from the Australian Institute of Criminology highlight similar dynamics in regional casinos where seasonal tourism fluctuations interact with staffing decisions.
Technology integration also plays a documented role, as electronic table management systems now alert supervisors to occupancy thresholds that trigger automatic staff reallocation requests. Facilities employing these tools show tighter correlations between staffing adjustments and activity metrics compared with venues relying on manual oversight alone. Industry associations tracking these implementations note that the systems reduce response times from an average of twenty minutes to under five minutes in monitored locations.
Regional Data Comparisons
Comparisons between Nevada properties and those operating under the Alcohol and Gaming Commission of Ontario reveal broadly consistent correlation coefficients, although absolute activity volumes differ by market size and regulatory framework. Nevada data through mid-2026 shows slightly higher sensitivity to staffing changes on weekends, while Ontario records indicate steadier weekday responses when staff additions target specific game variants with documented demand. Academic papers examining these cross-border patterns emphasize the value of standardized reporting formats that permit direct metric alignment.
Additional context comes from Singapore's Casino Regulatory Authority, whose public summaries separate card table performance and staffing allocations, allowing observers to identify parallel trends in a high-volume international setting. The consistency across these diverse regulatory environments supports the view that staffing-activity relationships represent operational characteristics rather than isolated local phenomena.
Conclusion
Available records demonstrate measurable correlations between staffing changes and activity levels in card game sections, with data from multiple regions confirming directional alignment when operational variables receive consistent tracking. Venues continue to refine scheduling practices based on these documented patterns, and ongoing data collection through 2026 provides further opportunities to examine how adjustments in staff deployment influence table utilization across different market conditions. Regulatory summaries and institutional analyses supply the factual foundation for these observations without introducing interpretive overlays.