How Regional Economic Indicators Align with Fluctuations in Lottery Ticket Sales Volumes Nationwide
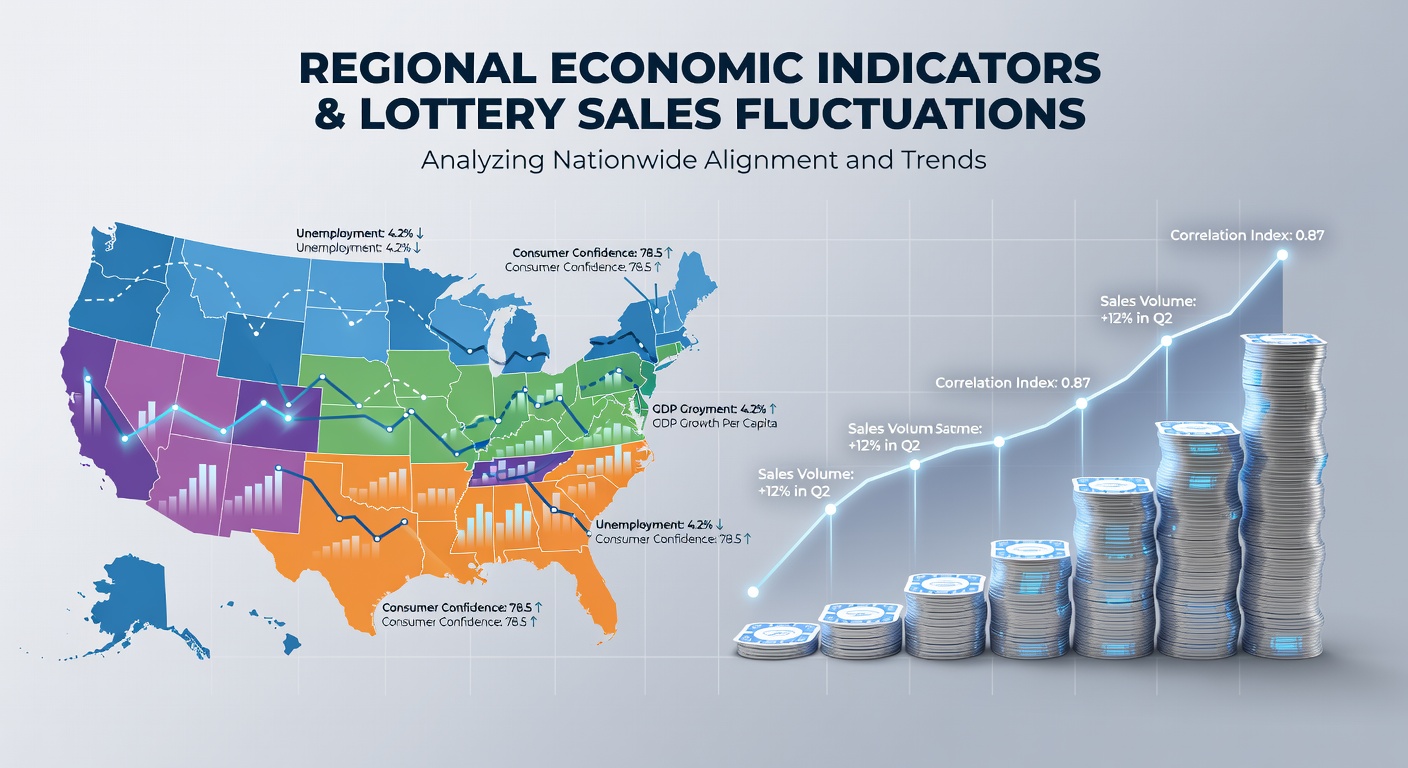
Regional economic indicators such as unemployment rates, median household income levels, and consumer confidence indices demonstrate measurable alignments with shifts in lottery ticket sales volumes across different parts of the country, according to aggregated state lottery commission reports and federal labor statistics. Researchers tracking these patterns note that areas experiencing higher joblessness often record increased per capita lottery purchases while regions with stable employment and rising wages show more moderate or declining sales trajectories over the same periods.
Core Economic Metrics and Sales Patterns
Data compiled through mid-2026 reveals that unemployment rates above the national average correlate with elevated lottery sales in multiple states, particularly where manufacturing and service sectors faced contractions earlier in the decade. The Bureau of Labor Statistics tracks these employment figures monthly, and when cross-referenced against lottery revenue filings, analysts find that a one-percentage-point rise in regional unemployment frequently coincides with a three to five percent uptick in ticket sales within six months. Meanwhile, states posting consistent job growth and wage increases tend to experience flatter sales curves during the same intervals.
Median household income serves as another strong alignment factor. Lower-income counties within larger states report proportionally higher lottery participation rates when compared to affluent suburban zones, even as overall state economies expand. This pattern holds across both coastal and inland markets, though the magnitude varies with local tax policies and the availability of competing entertainment options. Consumer confidence surveys from sources like the Conference Board further refine these observations by showing that dips in sentiment precede sales spikes in lottery products within three to four months.
Geographic Variations Across Major Regions
The Midwest presents one clear example where agricultural commodity prices and manufacturing output directly influence lottery volumes. When corn and soybean futures decline or auto plant layoffs occur, ticket sales in affected counties rise noticeably within the following quarter. In contrast, energy-producing states in the Mountain West display the opposite movement during periods of high oil and gas prices, with sales volumes contracting as household incomes strengthen. Southern states that combine tourism economies with retirement populations show steadier but lower-amplitude fluctuations tied more closely to seasonal employment than to broad unemployment metrics.
Northeastern industrial corridors exhibit mixed signals because dense population centers contain both high-unemployment urban cores and high-income suburbs. Lottery data from these areas indicate that sales growth concentrates in specific zip codes even while surrounding regions remain stable, underscoring the importance of granular rather than statewide analysis. Observers note that these localized pockets often align with census tract income data more precisely than with broader state-level indicators.
Recent Developments Through June 2026
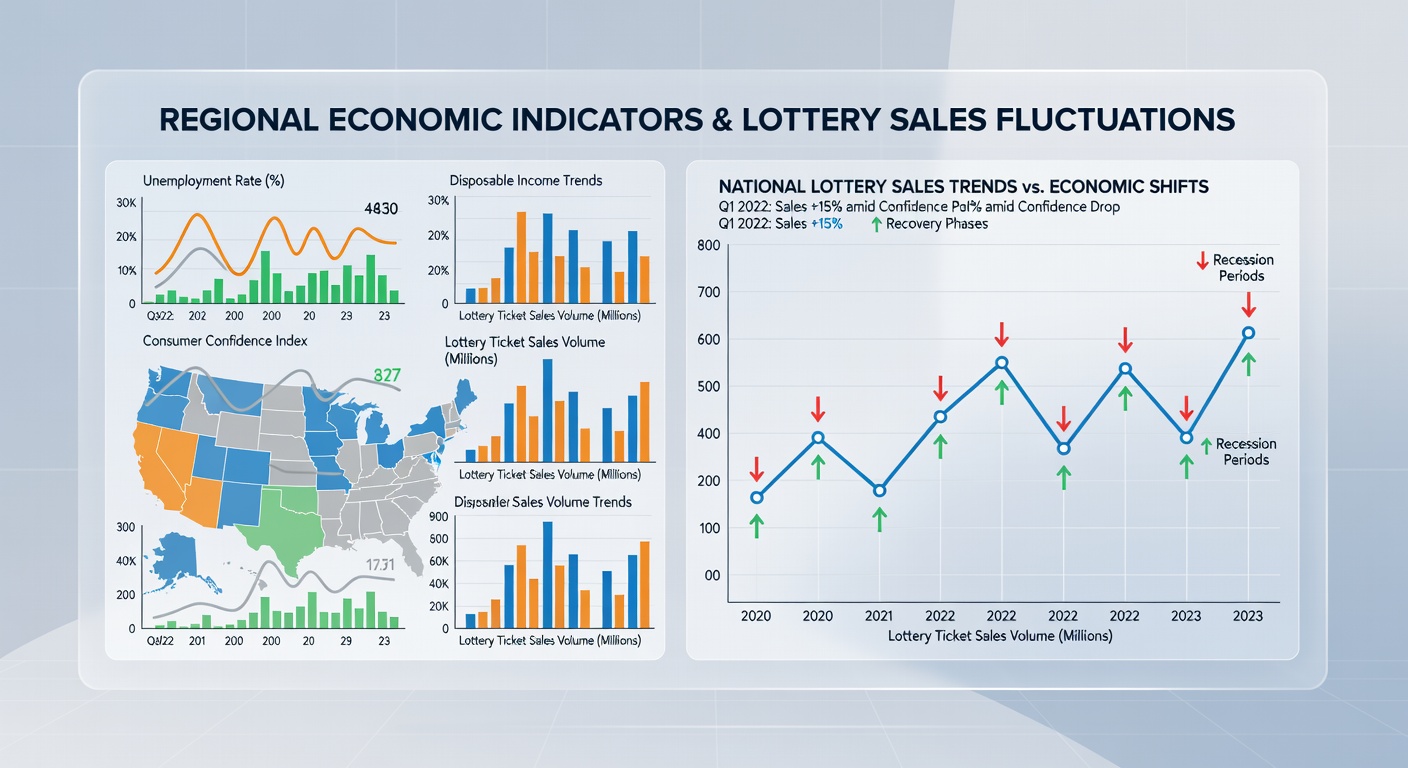
Through the first half of 2026, several states reported sales increases coinciding with cooling labor markets in specific sectors. Manufacturing-heavy districts in the Great Lakes region posted the strongest gains after employment figures softened in March and April, while Sun Belt states with robust construction and logistics hiring saw more modest growth. Federal stimulus effects from prior years had largely faded by this point, allowing underlying economic indicators to reassert their influence on purchasing behavior.
Inflation-adjusted income data released in late spring further clarified these alignments. Areas where real wages stagnated or declined recorded sustained lottery volume growth, whereas regions benefiting from energy cost reductions experienced slight pullbacks. Multi-state lotteries such as Powerball and Mega Millions showed participation spikes in economically pressured zones even when jackpot sizes remained average, suggesting that economic conditions exert an independent pull beyond prize size alone.
Data Sources and Analytical Approaches
State lottery commissions submit monthly sales reports that researchers cross-reference with county-level economic statistics from the Census Bureau and Bureau of Labor Statistics. Academic studies from institutions including the University of Michigan and Statistics Canada have applied similar methodologies across the border, confirming parallel patterns in provinces facing comparable employment shifts. These combined datasets allow analysts to isolate the contribution of individual indicators while controlling for variables such as jackpot size, advertising spend, and new game introductions.
Conclusion
Regional economic indicators continue to provide reliable signals for anticipating lottery sales movements nationwide, with unemployment, income, and confidence metrics demonstrating consistent directional alignments across diverse state economies. As additional monthly data accumulates through the remainder of 2026, these relationships offer a framework for understanding how broader labor market conditions translate into localized consumer spending on lottery products.